Mercator World Map is a cylindrical map projection designed to represent the Earth’s surface on a flat map while preserving local angles and directions. It became especially important for maritime navigation because a line of constant compass bearing, known as a rhumb line or loxodrome, appears as a straight line on a Mercator chart.
Unlike an equal-area world map, the Mercator projection does not preserve the relative area of continents. Its scale and area distortion increase toward the poles, making countries and regions at high latitudes appear much larger than they are in reality.
This collection provides printable Mercator world maps that can be useful for geography lessons, classroom activities, navigation studies, map-reading practice, research, and general reference.
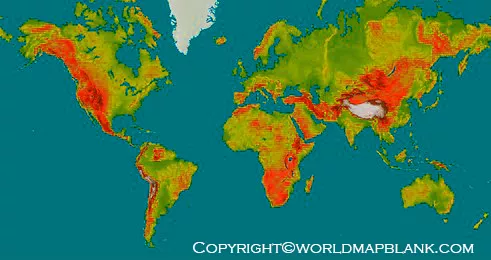
Mercator World Map Printable

A printable Mercator World Map provides a convenient way to study the world’s continents, countries, oceans, latitude, longitude, and the characteristic grid of the Mercator projection.
The projection uses straight, parallel meridians and horizontal parallels. The spacing between lines of latitude increases as they move away from the Equator. This mathematical arrangement allows constant compass courses to be represented by straight lines.
Mercator maps are therefore particularly useful when studying marine navigation and the relationship between longitude, latitude, and compass direction.

Mercator World Map High Resolution

A high-resolution Mercator map can be useful when you need a clearer view of country boundaries, coastlines, oceans, latitude lines, longitude lines, and other geographic features.
The Mercator projection is conformal, meaning it preserves local angles and shapes reasonably well at small scales. However, this does not mean that countries retain their true relative size. Area and scale become increasingly distorted toward the poles.
For this reason, a Mercator world map should be selected according to its purpose. It is particularly useful for navigation and studying direction, while an equal-area projection may be more appropriate when comparing the actual relative sizes of countries or continents.
World Map Mercator View

The World Map Mercator View displays the Earth using the characteristic cylindrical layout associated with the Mercator projection.
One of its most important features is the way it represents rhumb lines. A rhumb line crosses every meridian at the same angle, so it appears as a straight line on a Mercator chart. This makes plotting a constant compass course straightforward.
The projection was presented by Flemish cartographer Gerardus Mercator in 1569. His world map was specifically developed with navigation in mind.
A Mercator map is not intended to provide a perfectly accurate representation of the relative size of every region on Earth. Like every flat-world projection, it involves trade-offs caused by transferring the curved surface of the Earth onto a flat surface.
World Mercator Map with Latitude and Longitude

A Mercator map with latitude and longitude is useful for learning how the geographic coordinate system is displayed on a cylindrical projection.
Latitude measures a location north or south of the Equator, while longitude measures a location east or west of the Prime Meridian. On a standard Mercator projection, meridians appear as straight vertical lines and parallels appear as straight horizontal lines.
Students can use a printable map to practice identifying coordinates, locating countries and oceans, understanding hemispheres, and studying the relationship between geographic position and map projection.
The map can also be useful as a classroom reference, geography worksheet resource, study aid, or printable wall map.
What Is the Mercator Projection?
The Mercator projection is a cylindrical, conformal map projection. It was introduced by Gerardus Mercator in 1569 and became closely associated with marine navigation.
The key characteristic is that rhumb lines appear as straight lines. This allows a navigator to plot and follow a constant compass bearing conveniently on a chart.
However, the projection has an important limitation: distortion increases with latitude. Areas near the Equator experience considerably less scale distortion than areas closer to the poles.
The North and South Poles cannot be displayed as finite points on the standard mathematical Mercator projection because the projection’s scale increases without bound toward the poles.
Why Is the Mercator World Map Useful?
The Mercator projection remains valuable because it is designed around a specific geographic property: preserving local angles and making constant-direction courses easy to plot.
Common uses include:
- Maritime navigation and nautical charting
- Teaching map projections
- Geography and cartography lessons
- Latitude and longitude exercises
- Map-reading practice
- Studying rhumb lines and compass bearings
- Digital mapping and geographic visualization
- Printable educational resources
It is important to choose a map projection based on the purpose of the map. No flat projection can preserve every geographic property of the Earth’s curved surface at the same time.
Mercator World Map Distortion Explained
One of the most important facts about a Mercator World Map is that land areas become increasingly enlarged toward the poles.
For example, Greenland appears extremely large compared with regions near the Equator. This does not mean Greenland is actually comparable in area to Africa. The apparent difference results from the mathematical properties of the projection.
The Mercator projection is therefore useful for direction and local shape, but it should not be used to make simple visual comparisons of the true areas of continents and countries.
For area comparisons, an equal-area projection is generally more appropriate.
Interesting Facts About the Mercator World Map
- Gerardus Mercator presented his famous world map in 1569.
- The projection is cylindrical and conformal.
- Rhumb lines appear as straight lines on a Mercator chart.
- Meridians are represented as straight, parallel vertical lines.
- Parallels of latitude are straight horizontal lines with increasing spacing toward the poles.
- Area and scale distortion become much greater at high latitudes.
- The standard Mercator projection cannot represent the geographic poles as finite points.
How to Use a Printable Mercator World Map
A printable map can be used in several simple ways:
For students:
Print the map to identify countries, oceans, hemispheres, latitude, longitude, and major geographic regions.
For teachers:
Use it as a classroom reference, worksheet, geography activity, or projection-comparison exercise.
For map enthusiasts:
Use different versions to compare the visual characteristics of the Mercator projection with other world map projections.
For navigation studies:
Use a Mercator chart to understand rhumb lines, compass bearings, meridians, parallels, and the principles behind nautical charting.
For real-world navigation, always use current, official nautical charts and appropriate navigation systems rather than relying on a general printable world map.
Frequently Asked Questions About the Mercator World Map
What is a Mercator World Map?
A Mercator World Map represents the Earth’s curved surface using a cylindrical, conformal projection. It is particularly known for representing rhumb lines as straight lines, which makes it useful for navigation.
Who created the Mercator projection?
Gerardus Mercator, a Flemish cartographer, presented the well-known Mercator world projection in 1569.
A constant compass course, represented by a rhumb line, appears as a straight line on a Mercator chart. This makes plotting and following a constant bearing easier.
Does the Mercator projection show the true size of countries?
No. The Mercator projection does not preserve area. Distortion increases toward the poles, so high-latitude regions can appear much larger than their actual area.
Why does Greenland look so large on a Mercator map?
Greenland appears enlarged because the Mercator projection increases scale as latitude increases. The visual size on the map therefore does not represent its true relative area.
Can I use a Mercator World Map for latitude and longitude?
Yes. The straight latitude and longitude grid makes a Mercator map useful for studying geographic coordinates and practicing map-reading skills.
Is the Mercator projection still used today?
Yes. Mercator projections continue to be used in nautical charting and other mapping applications where their properties are useful.
Is a Mercator World Map accurate?
It depends on what you mean by accurate. It preserves local angles and is useful for direction, but it does not preserve true area and has increasing scale distortion toward the poles.
What is a rhumb line?
A rhumb line, also called a loxodrome, crosses each meridian at the same angle. On a Mercator chart, it appears as a straight line.
What is the best projection for comparing country sizes?
A Mercator map is not designed for accurate area comparison. An equal-area projection is generally more appropriate when the main goal is comparing the relative sizes of geographic regions.
Reference Links
https://www.nauticalcharts.noaa.gov/learn/nautical-cartography.html
https://oceanservice.noaa.gov/navigation/making-nautical-charts.html
https://www.usgs.gov/faqs/how-are-different-map-projections-used